Surface Plotter 3D PC
Knowle Consultants
گیم لوپ ایمولیٹر کے ساتھ PC پر Surface Plotter 3D ڈاؤن لوڈ کریں۔
پی سی پر Surface Plotter 3D
Surface Plotter 3D، جو ڈویلپر Knowle Consultants سے آرہا ہے، ماضی میں اینڈرائیڈ سسٹم پر چل رہا ہے۔
اب، آپ پی سی پر Surface Plotter 3D آسانی سے GameLoop کے ساتھ چلا سکتے ہیں۔
اسے GameLoop لائبریری یا تلاش کے نتائج میں ڈاؤن لوڈ کریں۔ مزید غلط وقت پر بیٹری یا مایوس کن کالوں پر نظر نہیں ڈالی جائے گی۔
بس بڑی سکرین پر Surface Plotter 3D PC کا مفت میں لطف اٹھائیں!
Surface Plotter 3D تعارف
Please see our Surface Plotter 3D Pro if you would prefer a version without adverts.
Allows real, complex, parametric and scalar field functions to be defined, plotted and manipulated in order to investigate their behaviour. It is also able to generate and plot fractal landscapes.
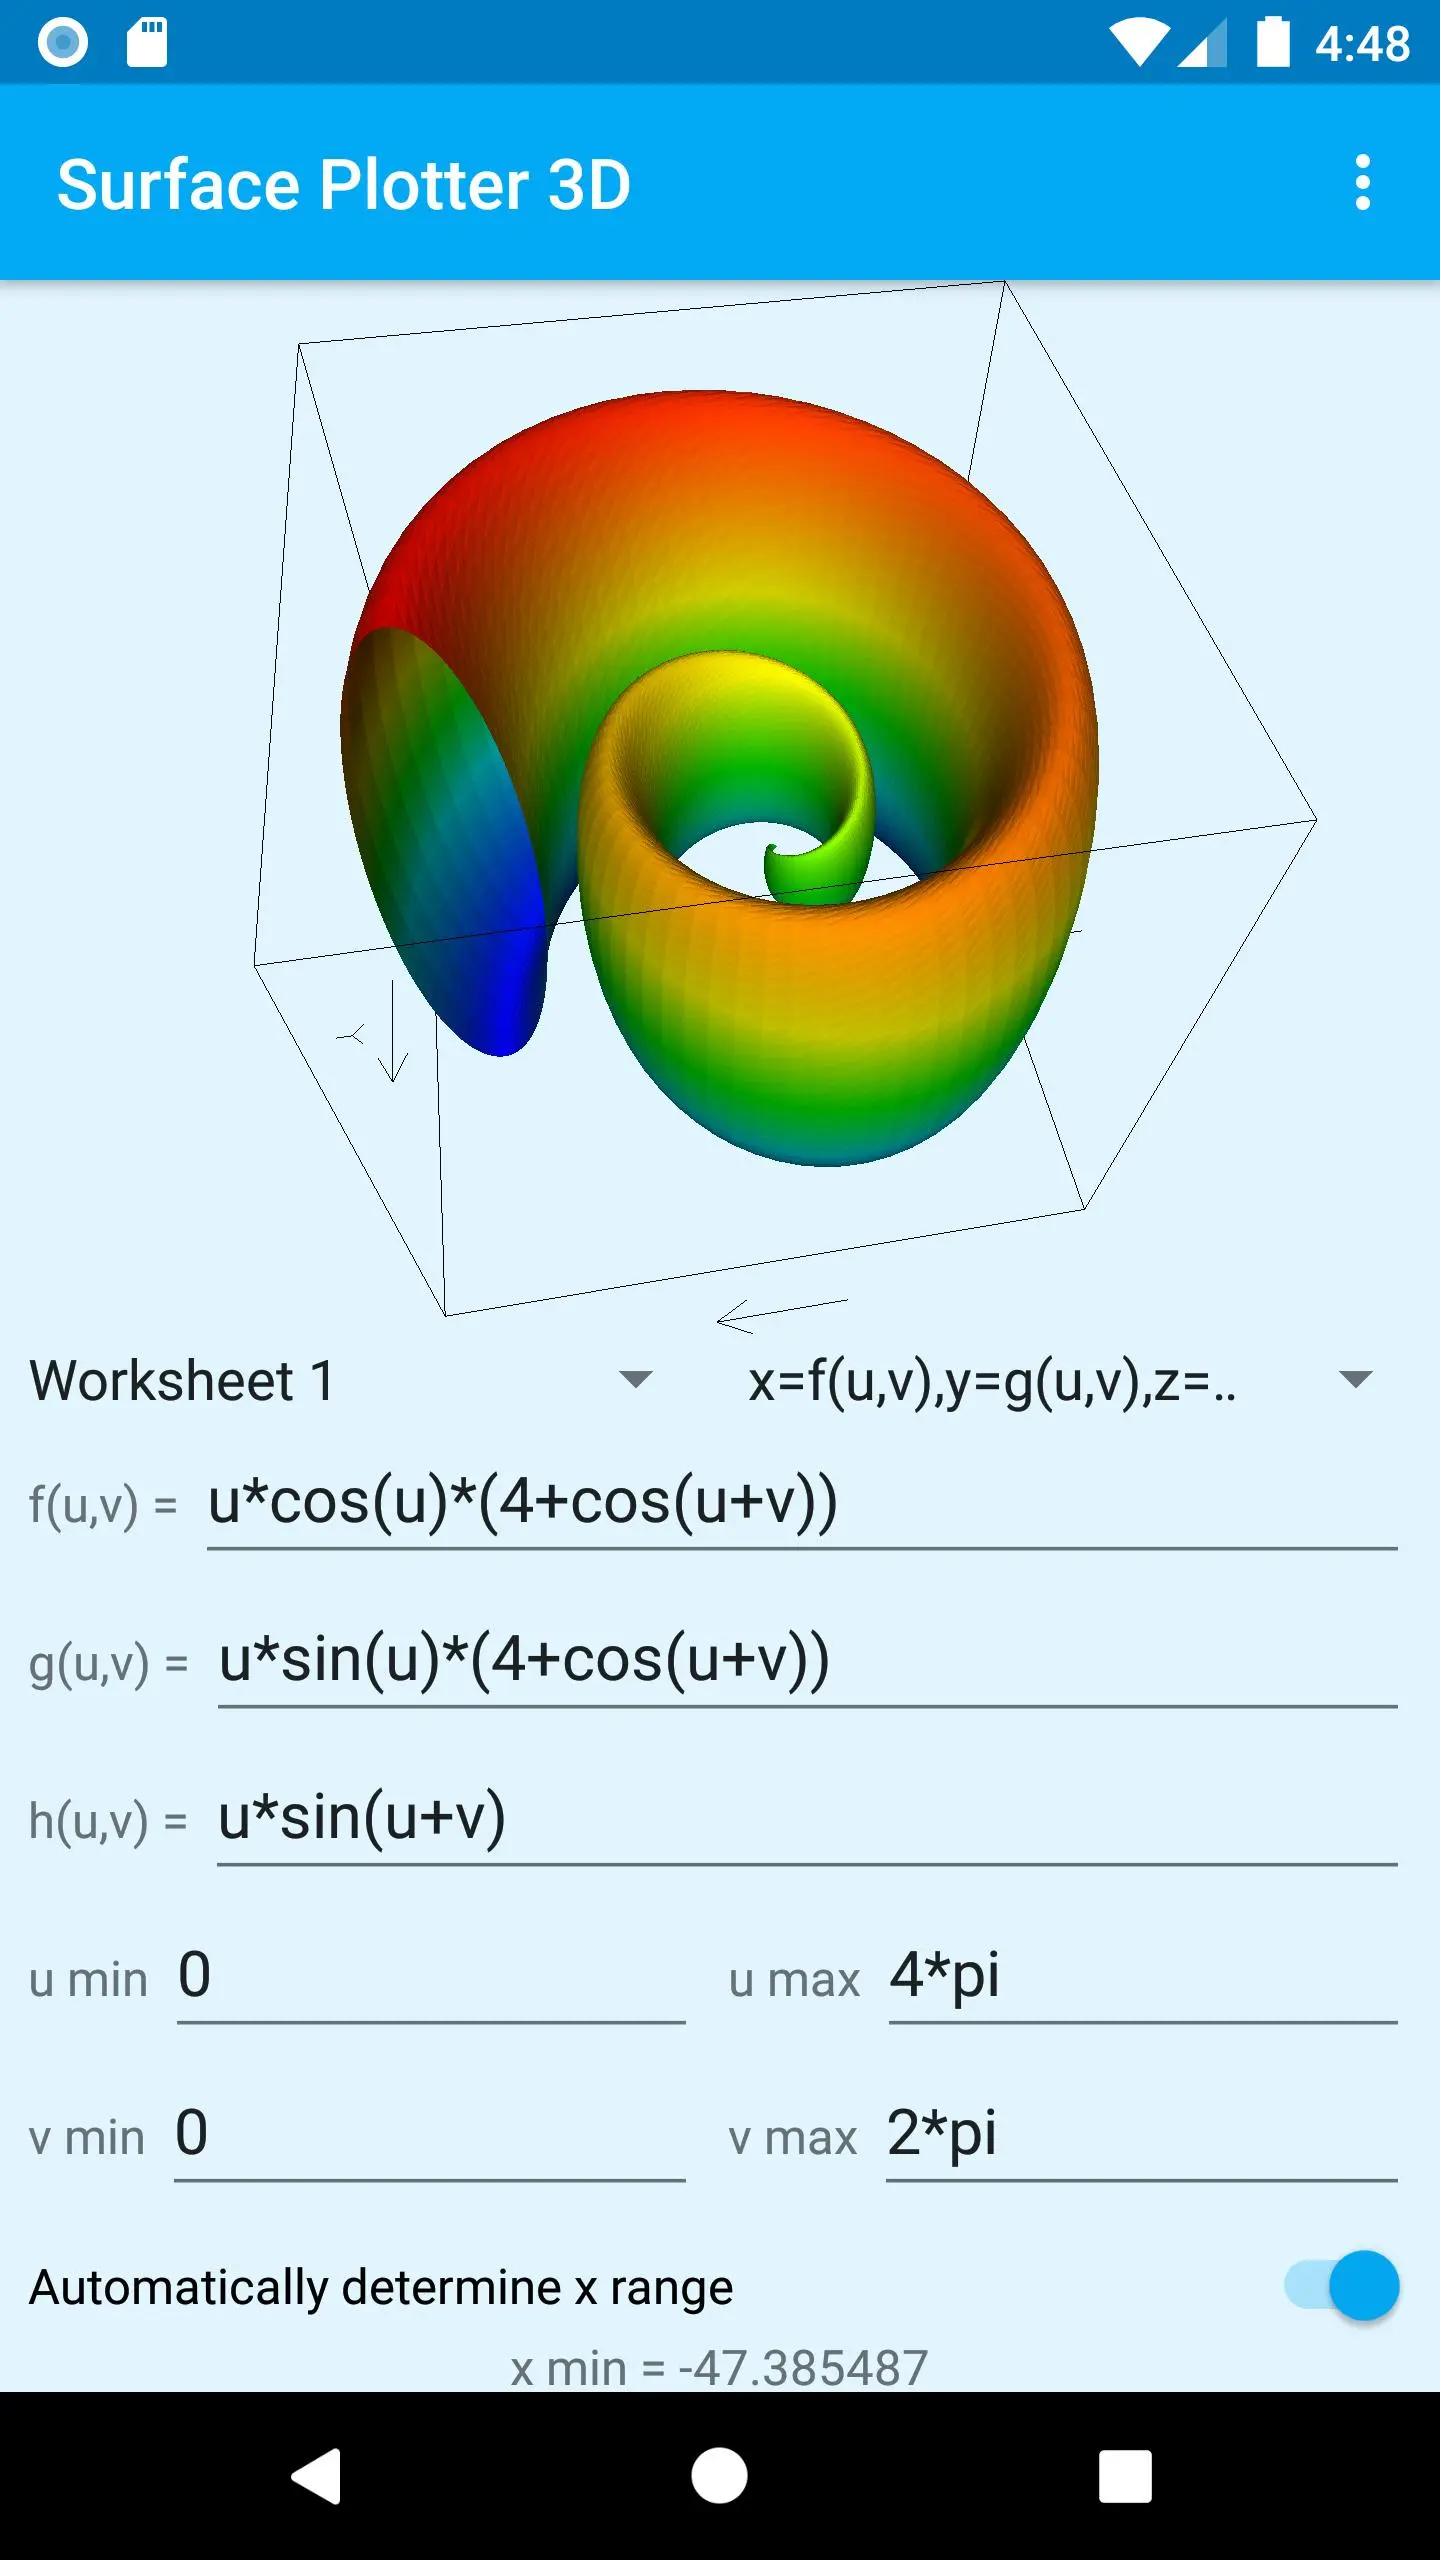
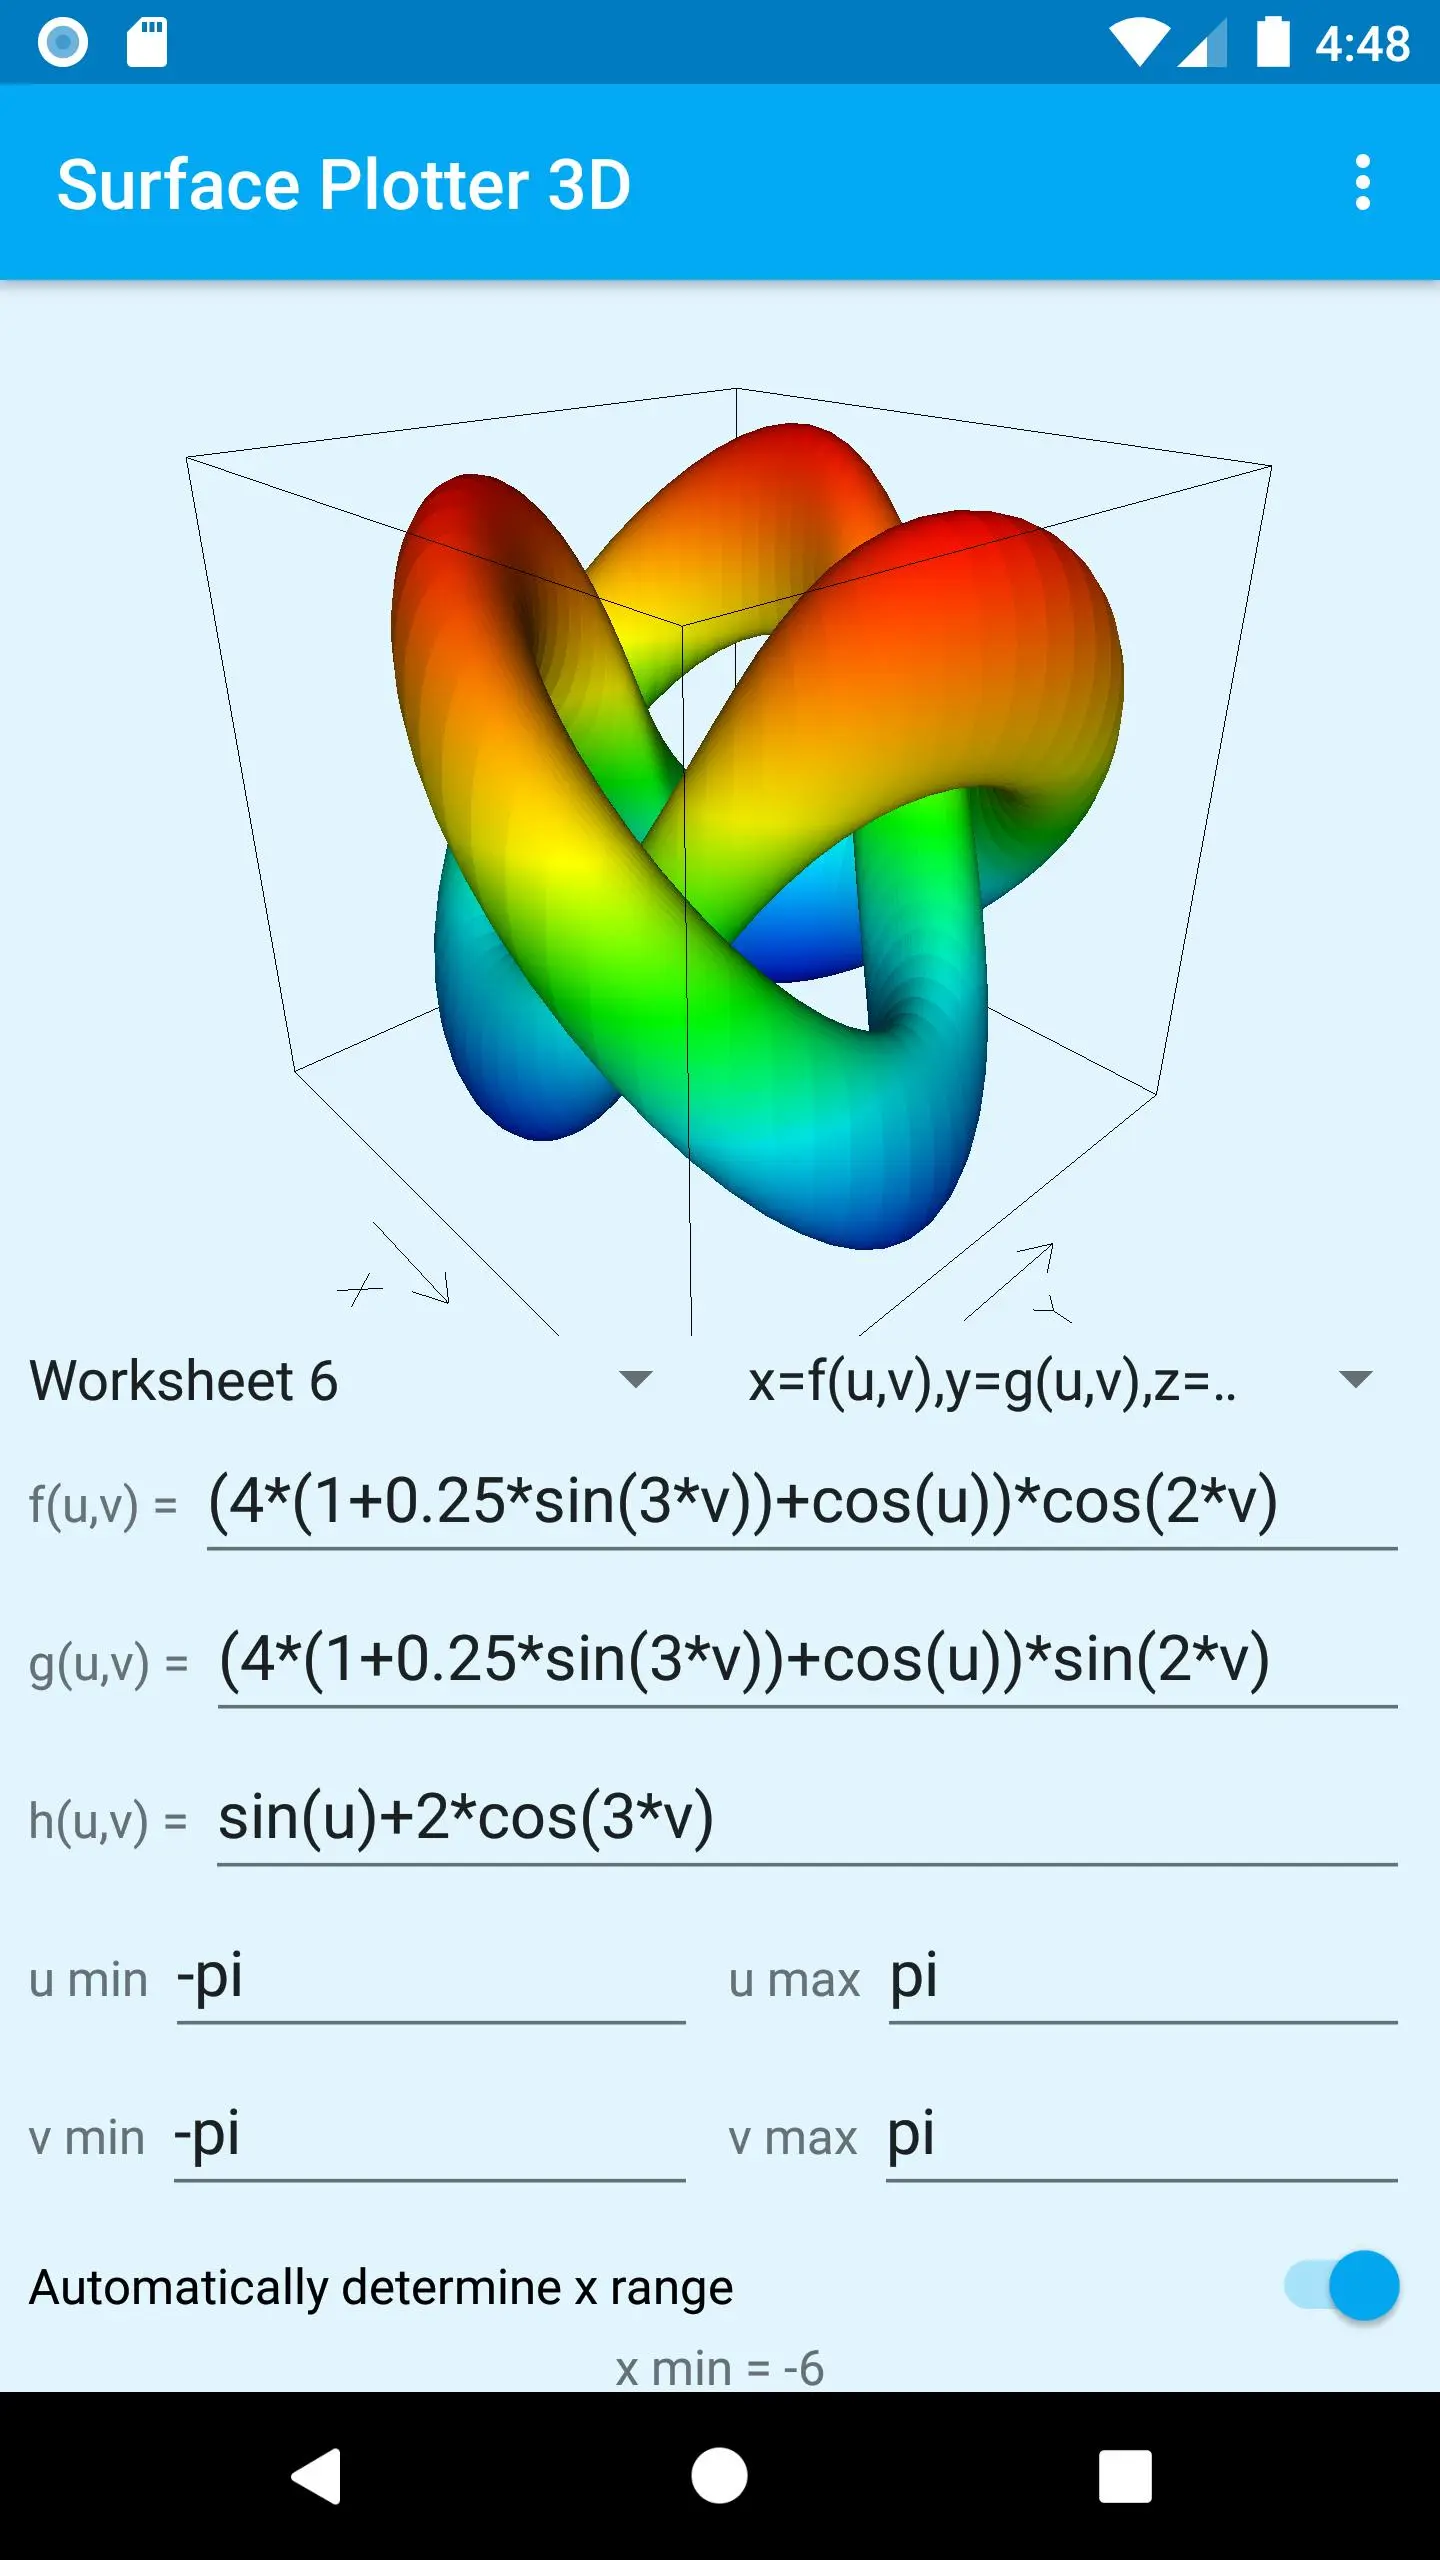
The application is based around worksheets where the user can define functions and then plot the corresponding surfaces. Each worksheet can define either a real function of the form z=f(x,y), a complex function of the form z=f(x+iy), a parametric function of the form x=f(u,v), y=g(u,v), z=h(u,v), scalar field functions of the form f(x,y,z)=k or f(r,theta,phi)=k, or a fractal landscape based on a random seed. The coordinate and parameter ranges used for the plot are also defined on the worksheet, as is the choice of whether coordinate ranges should be determined automatically by the application or manually entered by the user. This latter facility is useful for controlling the region of the plot that is displayed.
Everything entered on up to 10 worksheets is automatically saved, so you can define up to 60 plots (6 types per worksheet) and know they will be exactly the same next time you use the application. When you use the application for the first time you will notice that we have provided 60 samples for you to experiment with. Obviously these samples will be lost once you start to enter your own functions but they can be restored at any time by going into Android Settings and deleting the application’s data. Take care doing this because you will also lose any functions you have defined yourself.
A rich set of real and complex operators and functions are available so there is plenty of scope to experiment, ask yourself “what if…” questions, and generally have fun visualising mathematical functions and rotating them in 3D. Please refer to the help pages, accessed by tapping the menu button in the top right corner. These will give more details of how to use the application and define functions.
When a function and coordinate range have been entered the surface is plotted by tapping the floating View button. If there are any problems with the data entered then error messages will be displayed, otherwise the surface will be plotted and the user can rotate the plot by moving their finger over the screen. Whether or not rotation continues after the user's finger is lifted can be controlled using the menu at the top right of the screen.
The bounding box and axes can be shown or hidden using the menu at the top right of the screen. Note that axes will only be visible when they fall within the bounding box. When axes are not being shown, arrows at the base of the bounding box give an indication of the direction of increase of x and y values.
Colours start at blue for the bottom of the plot, going to red at the top. You will see a gradual transition from one colour to the next as the value of z changes.
Note that the application does not currently save the actual surface plot for each worksheet so each time you switch to a new worksheet you will need to tap the floating View button to display the plot. This decision was made to ensure the application can run on older devices where storage and processing power is limited. A future release might address this issue if there is sufficient demand.
You will notice that the plot is cleared whenever you edit the function definition. This might initially seem strange, but we felt it was important that any displayed plot reflects the current function definition. You just need to tap the floating View button again to display the plot for your newly edited function.
Finally, this is an active development project so there will be some interesting new releases coming soon. If you leave the application installed you will automatically receive these new releases.
We hope you enjoy using this application.
پیش نظارہ
ٹیگز
تعلیممعلومات
ڈویلپر
Knowle Consultants
تازہ ترین ورژن
1.29
آخری تازہ کاری
2025-09-03
قسم
تعلیم
پر دستیاب ہے۔
Google Play
مزید دکھائیں
پی سی پر گیم لوپ کے ساتھ Surface Plotter 3D کیسے کھیلا جائے۔
1. آفیشل ویب سائٹ سے گیم لوپ ڈاؤن لوڈ کریں، پھر گیم لوپ انسٹال کرنے کے لیے exe فائل چلائیں۔
2. گیم لوپ کھولیں اور "Surface Plotter 3D" تلاش کریں، تلاش کے نتائج میں Surface Plotter 3D تلاش کریں اور "انسٹال کریں" پر کلک کریں۔
3. گیم لوپ پر Surface Plotter 3D کھیلنے کا لطف اٹھائیں۔
Minimum requirements
OS
Windows 8.1 64-bit or Windows 10 64-bit
GPU
GTX 1050
CPU
i3-8300
Memory
8GB RAM
Storage
1GB available space
Recommended requirements
OS
Windows 8.1 64-bit or Windows 10 64-bit
GPU
GTX 1050
CPU
i3-9320
Memory
16GB RAM
Storage
1GB available space